Customer experience insights tell you about how your people feel when shopping with you. A good experience can be the difference between loyalty and losing a customer to a competitor.
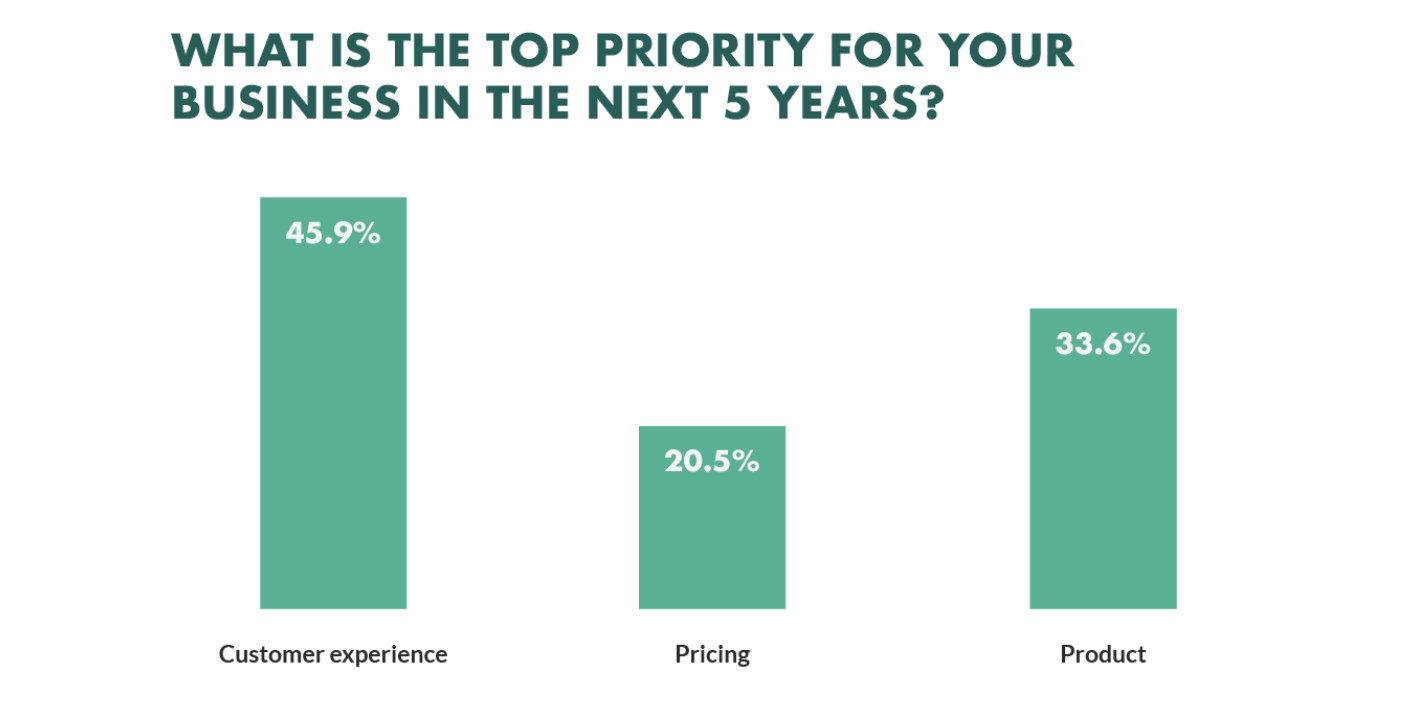
Businesses cite customer experience as the top priority in the coming years. But, to gauge customer satisfaction, you need to quantify it.
Customer experience insights help you quantify customer experience so that you can effectively measure it in the form of averages, ratios and percentages. These insights not only help you analyze the performance of your brand but also predict customer behaviour. They can also help you gauge the success of your website design and marketing efforts.
So you know you can do a lot with customer experience insights, but first, you need to understand what they are and what they mean for your eCommerce business.
7 Customer Experience Insights You Should Track for eCommerce
Below are some of the most important customer experience insights that you should track for your eCommerce. These insights will give you quantitative values that determine the quality of experience that your customers get from your brand.
1. Customer Satisfaction Score (CSAT)
This insight tells you about the satisfaction level of your customers. It's measured in the form of a rating between 1 and 5.
You can create a feedback form on your website to collect data for CSAT.
Typically, eCommerce websites ask for satisfaction ratings after eCommerce order fulfilment. If you ask for customer feedback after purchase you cannot gauge customer satisfaction with the shipping and delivery process.
.png?width=2240&height=1260&name=Blog%20visuals%20(29).png)
Alongside ratings, you can also ask customers about areas of improvement. This will help you identify the changes you need to make for a better customer experience. If you want to understand customer satisfaction at different stages of the purchase journey, you can conduct multiple CSAT surveys.
A CSAT survey does require some effort on behalf of the customers. You can make their job easier by using interaction builder tools such as forms, chatbots, and interactive videos. These tools can increase customer feedback by as much as 40%. You can also use these tools to achieve other sales, marketing, and customer service goals.
Customer Effort Score (CES)
Customer Effort Score tells you how easy or difficult it was for the customer to use your eCommerce website. You can only acquire CES through a survey. It too is measured in the form of a rating. The scale of the ratings depends on the number of options you include in the survey.
For an eCommerce website, you can use the 5 options system. These options ask the customers about the difficulty level of using the website ranging from “Very Easy” to “Very Difficult”. You can get more information about issues if you ask for CES for different aspects of the website. This can include navigation, product information, the check-out process, etc.
This way you can figure out the aspects that you need to improve to help the customers. For instance, if the CES score for product information is high, you can segment the information for clarity or convert parts of the information into visuals to make it more engaging.
Just like the CSAT score, you can also gather information on CES through customer surveys using interactive tools. These tools can also help you improve the CES score. For instance, a shoppable video and one-to-one shopping guide can make it easier for the customer to browse products and pick the right one.
Churn Rate & Retention Rate
Churn rate and retention rate are diametric opposites of one another. The churn rate shows how many customers have stopped coming to your website, while the retention rate shows how many of them are still visiting your website.
You have to calculate the churn rate and retention rate in deference to a time period. It can be a week, a month, or a year. In the below formula, we will use the year 2022 as the time period.
The Formula for Churn Rate:
(A - B) * 100 / A
In the above formula:
A = Number of Customers on 1st Jan 2022
B = Number of Customers on 31st Dec 2022
Formula for Retention Rate:
(X - Y)*100 / Z
In the above formula:
X = Number of Customers on 31st Dec 2022
Y = Number of New Customers Acquired in 2022
Z = Number of Customers on 1st Jan 2022
A high churn rate is an indicator of a bad customer experience, while a high retention rate is a sign of a pleasant customer experience. If you are experiencing a high churn rate, you must focus on improving customer experience and engagement rates.
Live video shopping streams can help you promote your products and engage customers. You can also use video calls to engage existing customers. Additionally, you can encourage live purchases through limited-time offers and discounts.
Repeat Customer Rate (RCR)
Repeat Customer Rate is the ratio between the total number of customers and the number of customers who purchase more than once. RCR tells you about the loyalty of your customer base and the experience of first-time customers.
Formula to Calculate Repeat Customer Rate:
(Number of Repeat Customers * 100) / Total Number of Customers
RCR gives you an estimate of the percentage of customers who are likely to buy from you again. If this percentage is very low, you need to improve the customer experience of first-time buyers. You can also improve RCR by offering incentives for repeat customers.
Average First Response & Resolution Time
Customers expect eCommerce companies to respond to and resolve their queries as fast as possible. These two insights are interconnected. If you can respond to a customer faster, you can also reduce the average resolution time.
To calculate either of these, you first need to collect data on the first response time and resolution of individual customer queries over a period of time. You then need to convert each of these into a time unit such as seconds or minutes.
Formula to Calculate Average First Response Time:
Sum of First Response Time for All Queries / Total Number of Queries
Formula to Calculate Average Resolution Time:
The sum of Resolution Time for All Queries / Total Number of Queries
These two insights are intricately linked to customer experience. If you keep the customer waiting for an answer they might turn to another brand for shopping.
Customers typically ask questions about products, services, payment options, delivery times etc. These questions are obstacles that prevent customers from buying your products. If you can address these obstacles quickly, you increase the likelihood of a purchase. If you need tips on how to reduce your response time check out our blog post.
For eCommerce, features such as Live Chat and AI Chatbotscan effectively reduce the resolution time and create a better customer experience.
Conversion Rate
This is perhaps the most talked about metric to indicate customer experience on an eCommerce site. It is the ratio between the number of visitors and the number of purchases over a period of time. If your conversion rate is 3%, it means that you get 3 customers for every 100 visitors to your website. The global average conversion rates change based on the product category.
.png?width=2240&height=1260&name=Blog%20visuals%20(30).png)
Formula to Calculate Conversion Rate:
(Total Number of Purchases * 100) / Total Number of Visitors
Conversion rate helps you measure the success of your website’s UX as well as marketing campaign success. It can also tell you about the relative popularity of different products on your eCommerce site. If you provide a better customer experience, the conversion rate should increase. Every eCommerce business should aspire for a conversion rate higher than the industry average.
You can use an AI chat assistant to aid the shopping experience for your customers. These bots can guide the customers towards the right products by asking them questions about their preferences. You can also use live chat or even gamification to engage your website visitors with your top products in a more interactive manner.
Net Promoter Score (NPS)
NPS tells you the likelihood of people recommending your eCommerce platform or products to others. Like CSAT, you need a feedback survey to calculate NPS. You can conduct the survey on your website after purchase or launch a marketing campaign for this purpose.
An NPS survey asks the customer how likely are they to recommend your products or brand to others. The customers can use a number ranging from 1 to 5 or 1 to 10 for the answer. Additionally, you can ask the customer to give a reason for their answer.
If the NPS is high, it means that your customers had a good experience with your brand. If it is low, you need to make improvements. Aside from overall eCommerce experience, you can also collect NPS for different products on your website.
Conclusion
The more you can measure the above insights, the better you can understand your customers and their behaviours. You can gather these insights for your entire website, as well as individual aspects of it.
Customer experience insights are also helpful if you want to check the effectiveness of your marketing campaigns or website improvements. On the other hand, you can also use them to identify the problem areas and make improvements accordingly. Then you can measure customer experience again to check whether the improvement are yielding desired results.
Author bio
The article was written by Nicholas Woodward, the Country Manager at PACK & SEND, a leading and respected brand in eCommerce, logistics, and freight delivery solutions, with over 15 years of experience in the logistics, eCommerce, retail, and franchise industries. Nicholas has thought leadership and expertise across strategic planning, leadership, eCommerce, B2C logistics, and organisational performance & growth. Find him on LinkedIn.