Online shopping has shifted and moulded over the last 2 decades in ways that not even the Father of the Internet could have predicted.
With this list of e-commerce statistics, you’ll have a better understanding of the current state of online shopping and the key online buying behaviours of consumers.
What used to be considered futuristic is now the status quo in terms of online shopping, so here's your chance to make sure your online shop is ready for the status quo.

Here’s a handy table of contents if you want to click through to your section of choice:
1. Stats on the current state of online shopping
2. Stats on online shopping behaviours
3. Stats on shopping cart abandonment
4.. Stats on product return rate
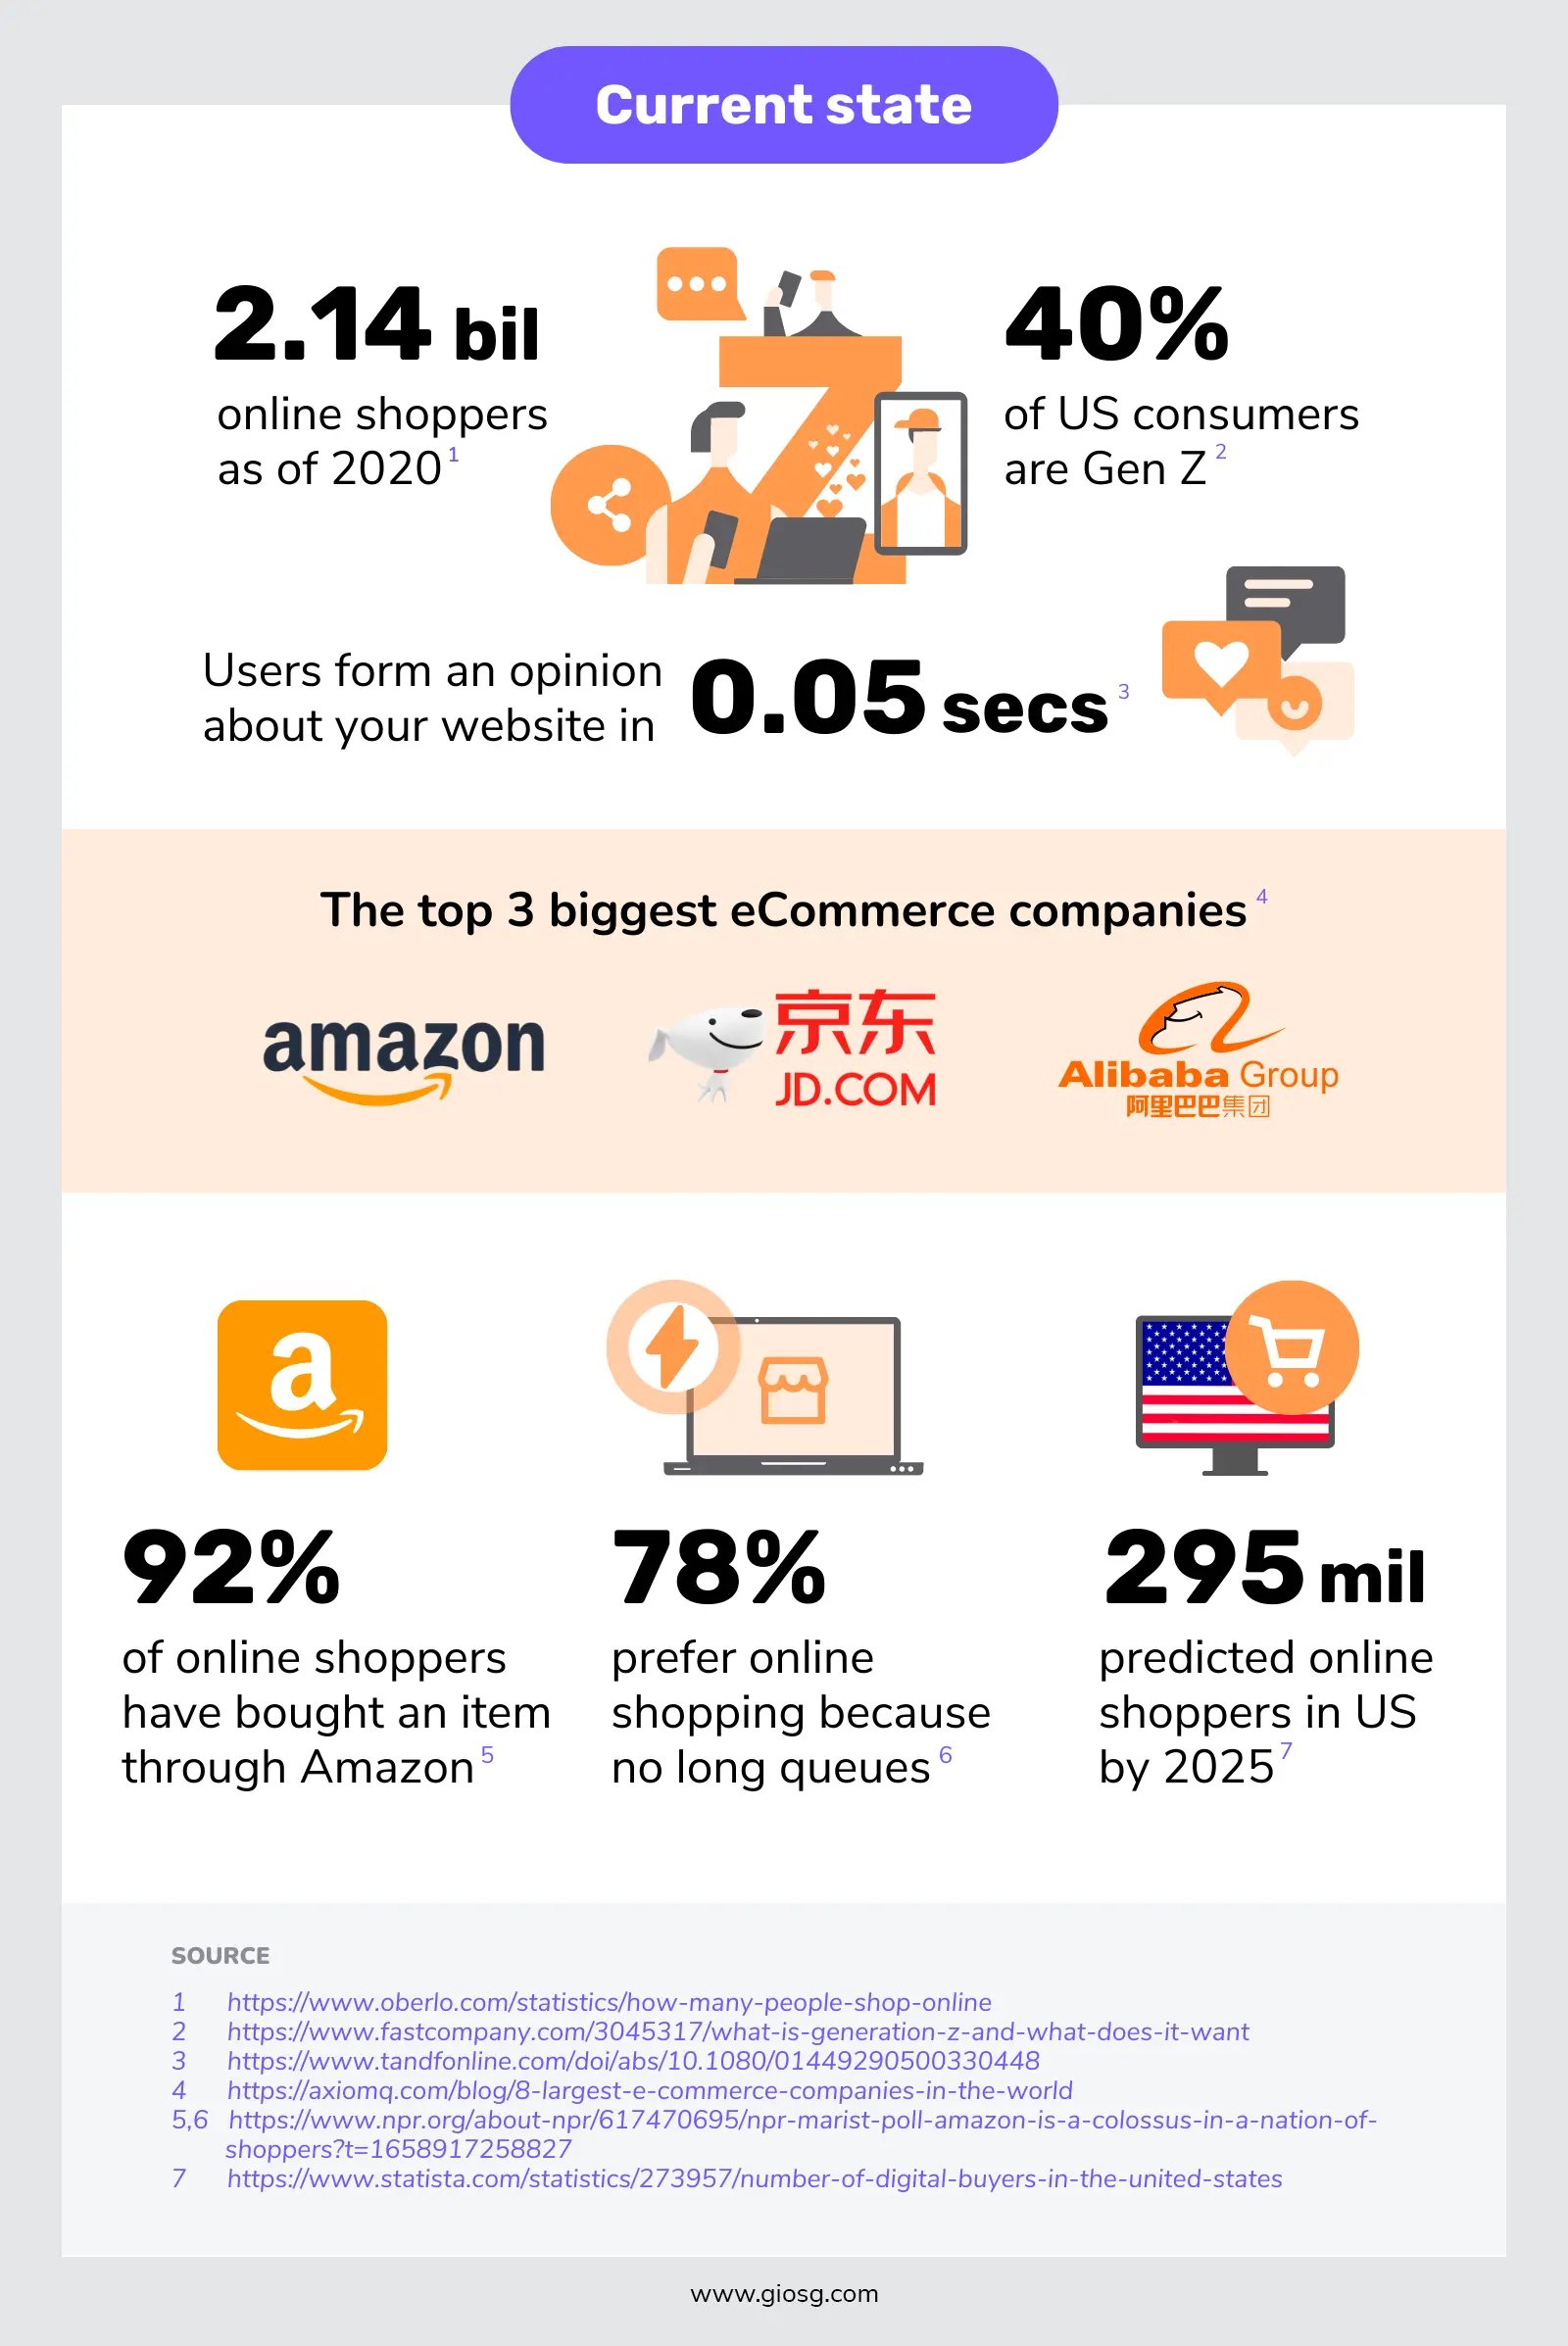
Statistics about the current state of online shopping:
- 2.14 billion online buyers as of 2020, 4.4x Year over Year increase (1)
- Gen Z will account for 40% of consumer shopping in a few years (2)
- Takes 0.05 seconds for users to form an opinion about your website(3)
- The top 3 biggest eCommerce companies are Amazon, Jingdong, and Alibaba (4)
- 92% of online shoppers say they have bought an item through Amazon (5)
- 78% of online shoppers prefer to shop online because there are no long queues like in person. (5)
- By 2023, in the US alone, it is expected that there will be 300 million online shoppers (6)
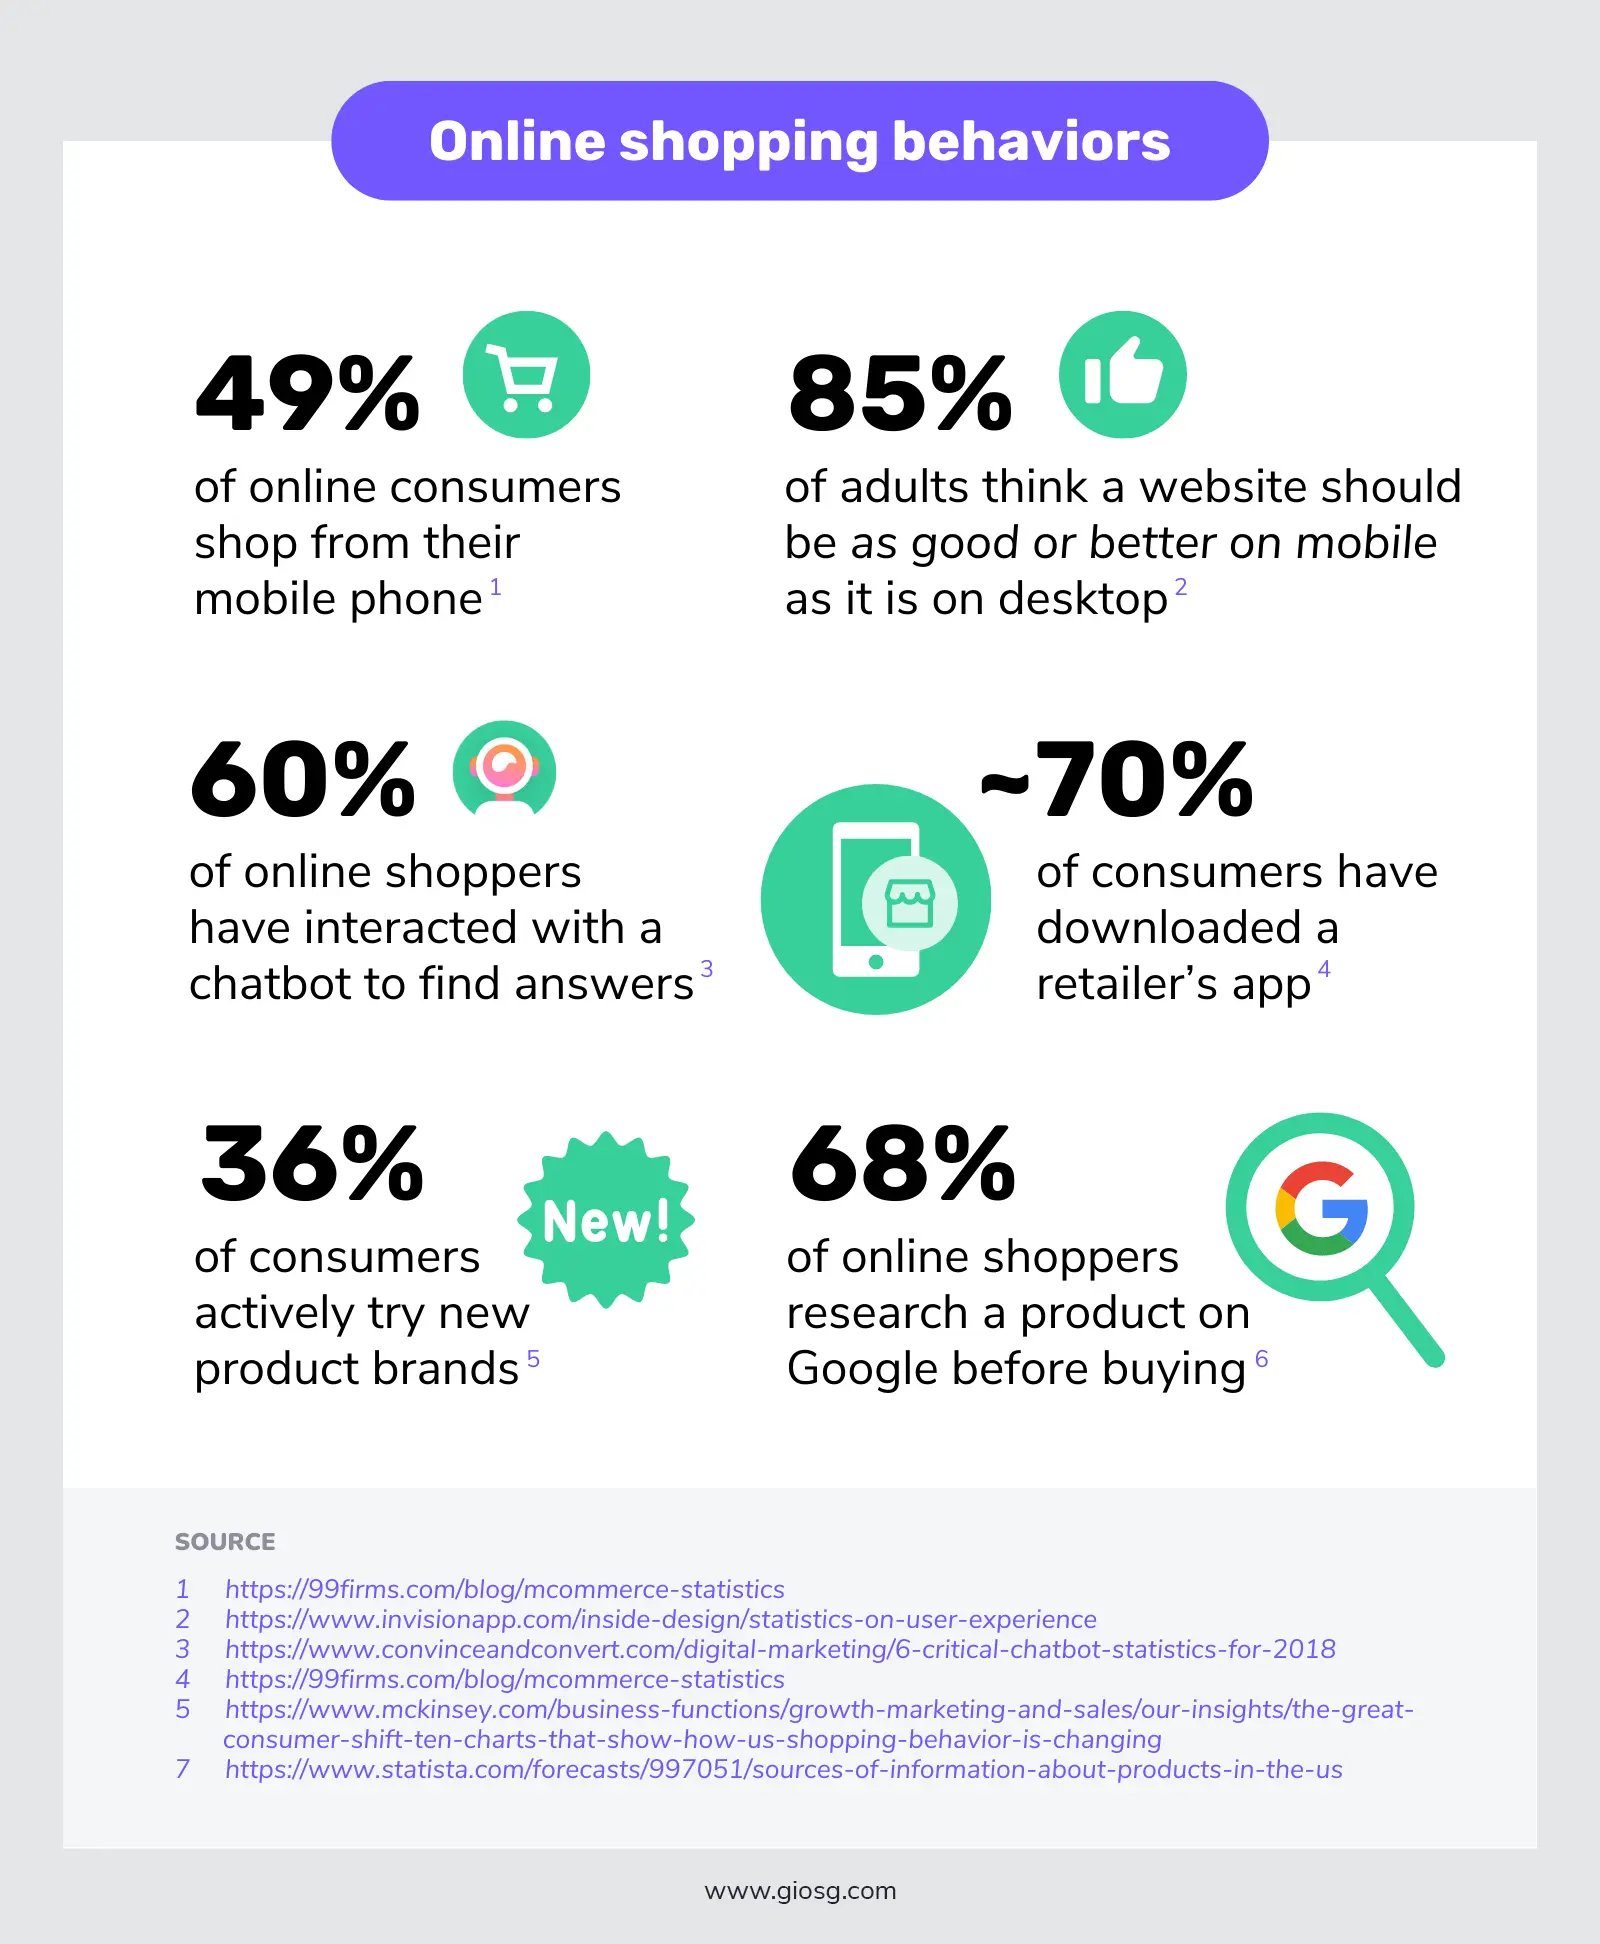
Statistics about online shopping behaviours
- 49% of online shoppers use their mobile phone for shopping. (7)
- 85% of adults think that a company’s website should be as good or better on mobile as it is on desktop (8)
- Nearly 70% of consumers revealed that they have downloaded a retailer’s app. (7)
- 60% of online shoppers have interacted with a chatbot to find answers. (9)
- Consumers are now switching brands rapidly, 36% of consumers try actively try new product brands (10)
- 68% of Online Shoppers go to Google to research a product before buying (11)
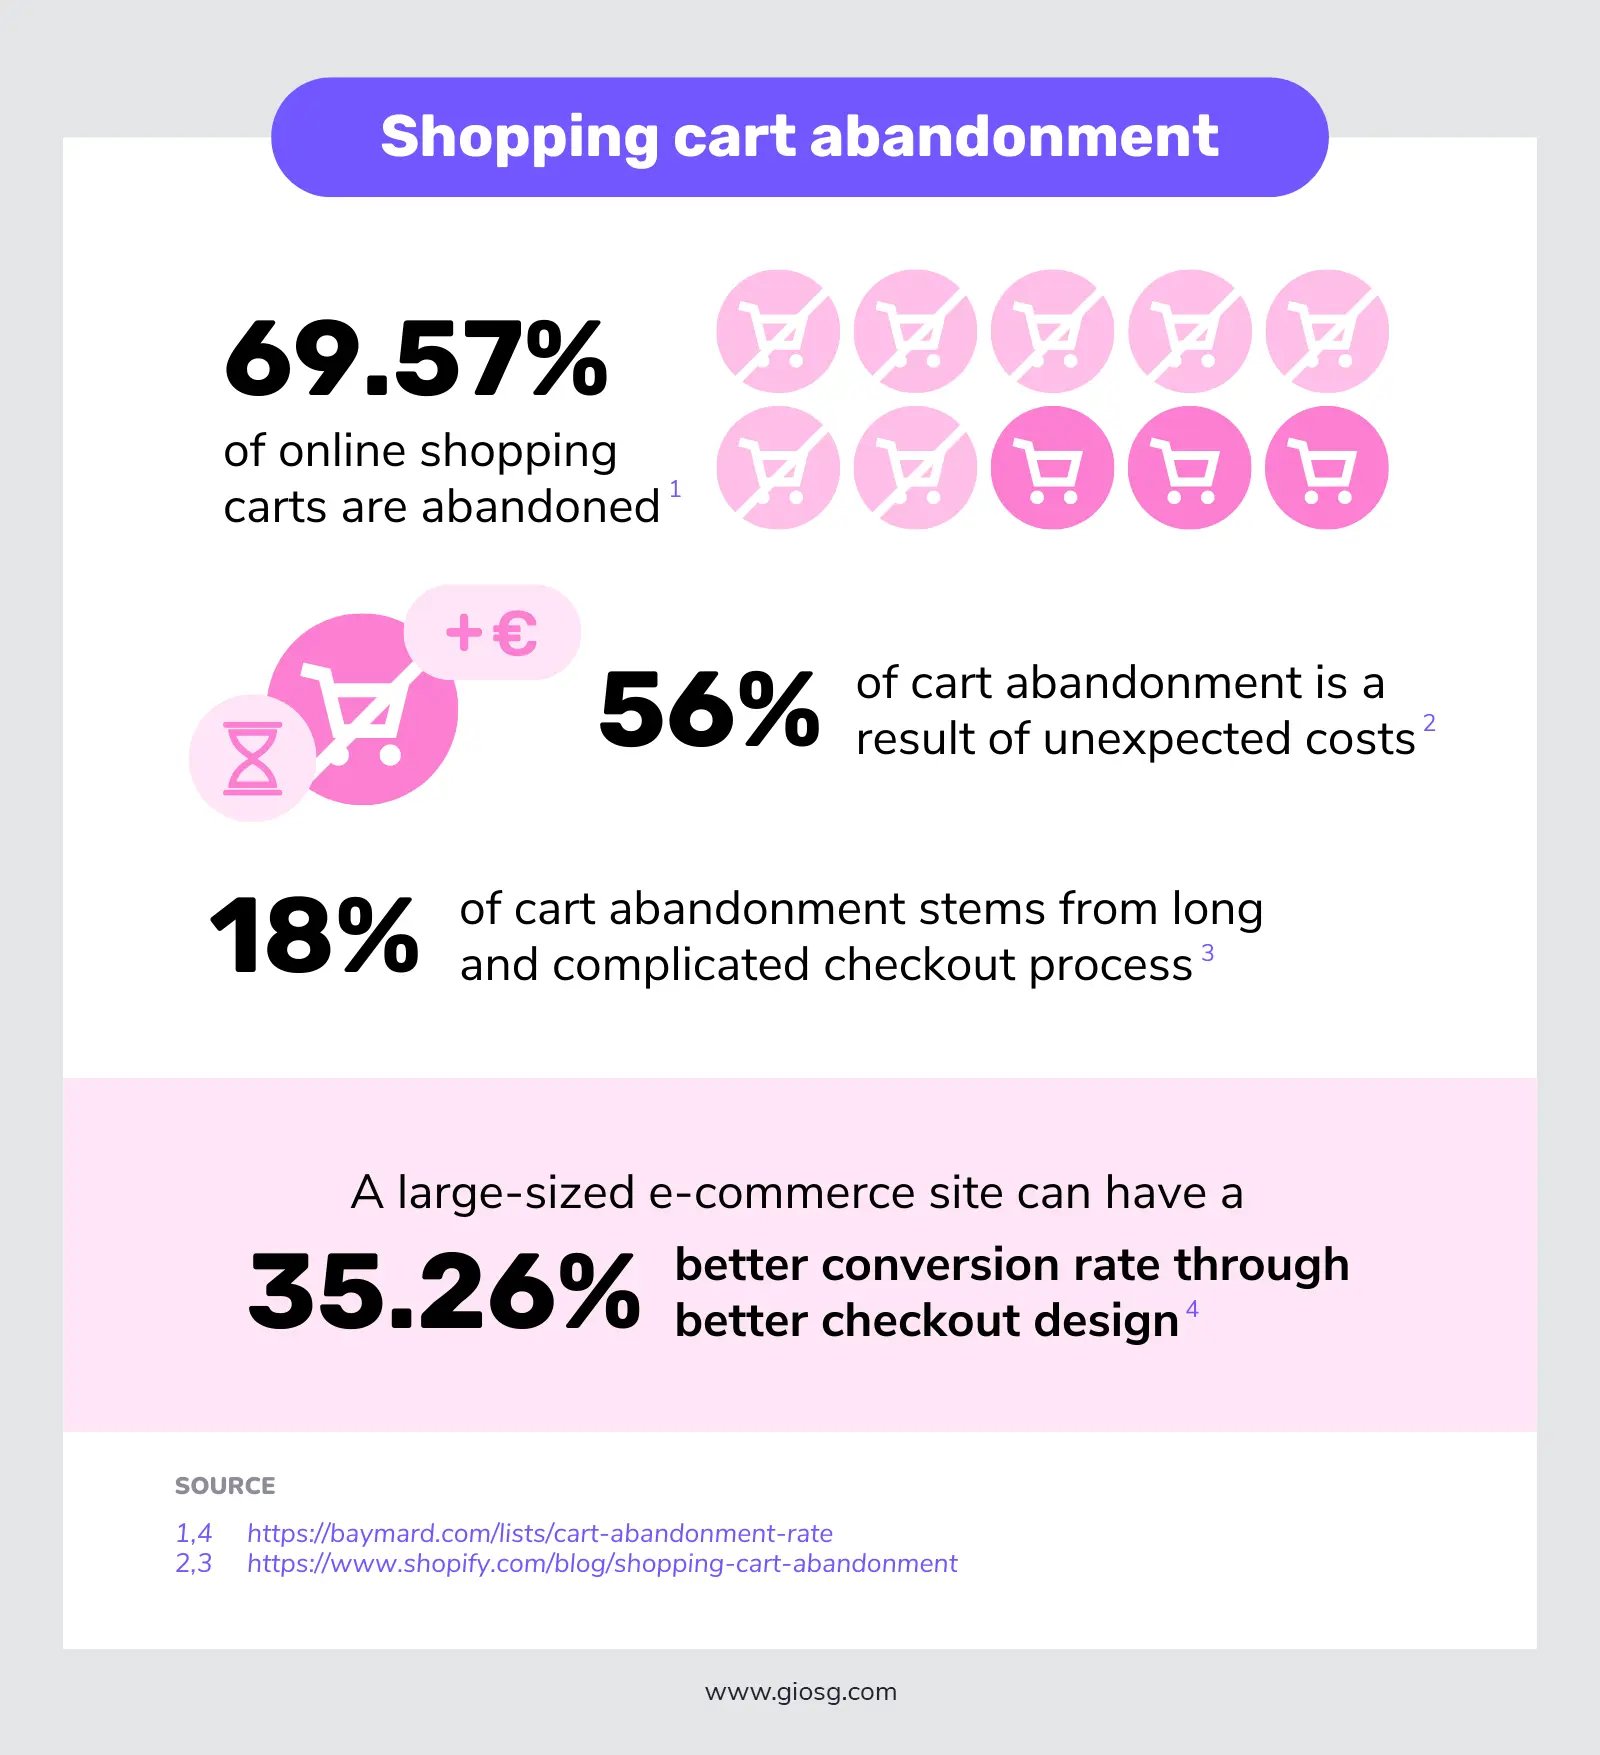
Statistics on shopping cart abandonment rate
- According to Baymard Institute, 69.57% of online shopping carts are abandoned.
- 56% of cart abandonment is a result of unexpected costs. (12)
- Long and complicated checkout process is to blame for 18% of cart abandonment. (12)
- The average large-sized e-commerce site can gain a 35.26% increase in conversion rate through better checkout design. (Baymard Institute)
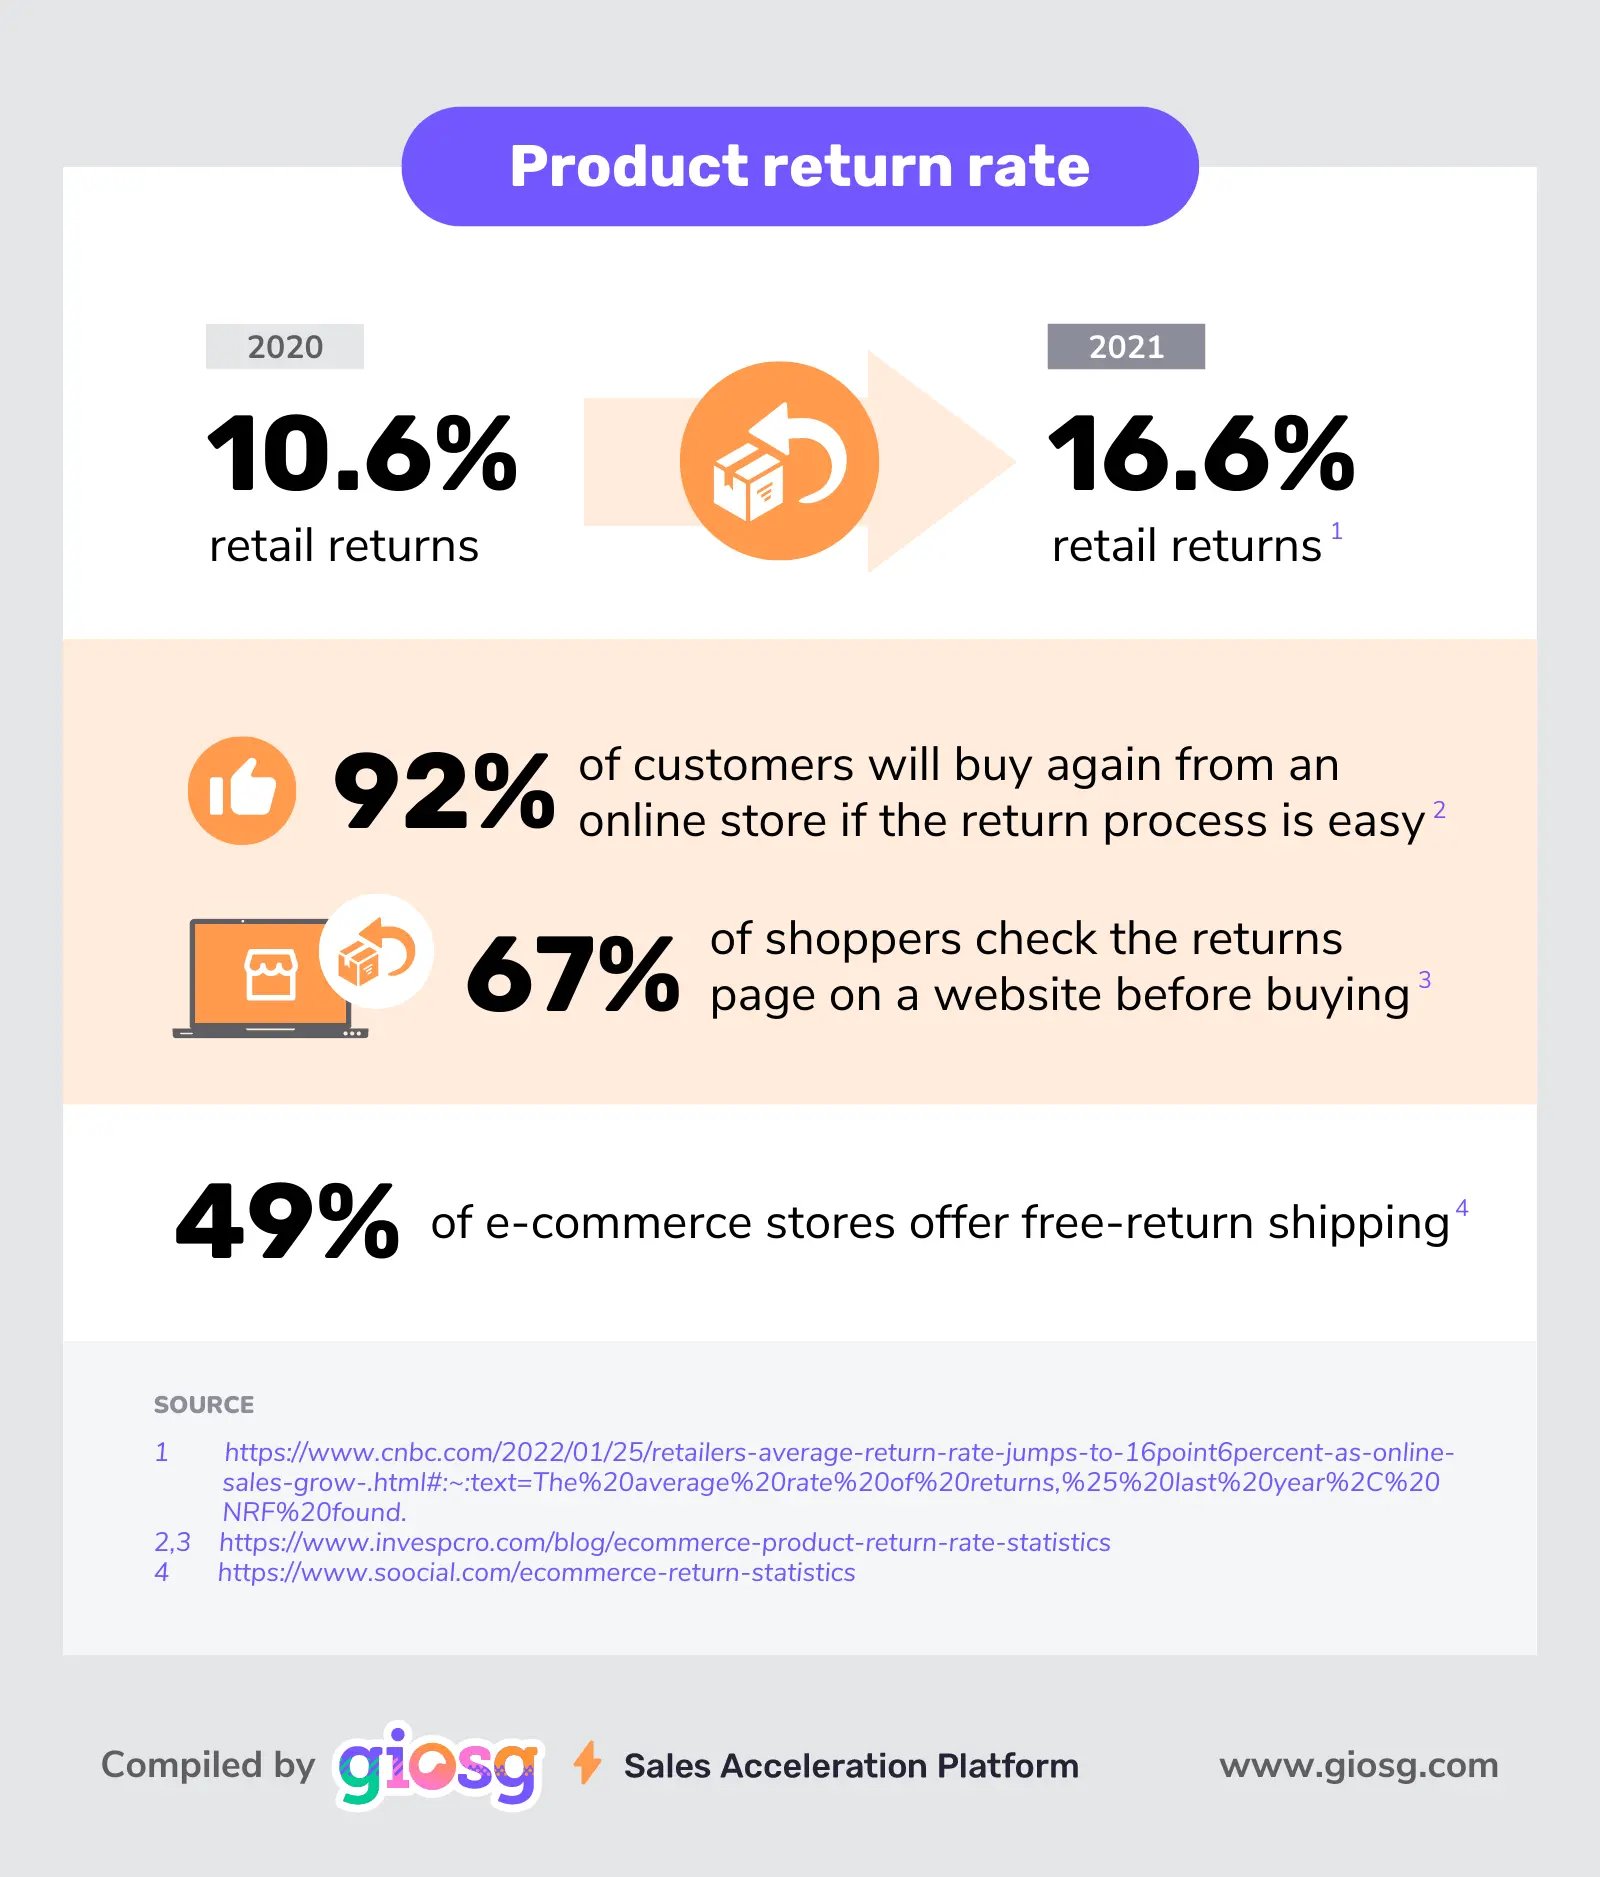
Statistics on product return rate in e-commerce
- Retail returns jumped to an average of 16.6% in 2021 versus 10.6% in 2020 according to a survey by the National Retail Federation and Appriss Retail. (13)
- 92% of shoppers say they would buy again from an online store if the return process is easy (14)
- 67% of shoppers check the returns page on a website before buying (14)
- Around 49% of e-commerce stores offer free-return shipping (15)
Looking for more stats to help you take a closer look into the e-commerce sphere? Jump on over to our blog post about Online Shopping Trends statistics here.
Pssst you can download our full infographic on these key online shopping statistics by clicking here.
Resources cited:
1. Oberlo. "How many people shop online in 2022."
2. Fast Company. "What Is Generation Z, And What Does It Want?" (2015)
3. Gitte Lindgaard, Gary Fernandes, Cathy Dudek & J. Brown. "Attention web designers: You have 50 milliseconds to make a good first impression!" (2016)
4. Axiom Q. "8 Largest eCommerce Companies in the World and No, Alibaba is Not the Largest Chinese eCommerce" (2022)
5. NPR. "NPR/Marist Poll: Amazon is a colossus in a nation of shoppers!" (n.a)
6. Statista. "Number of digital buyers in the United States from 2017 to 2025" (2022)
7. 99 Firms. "Mcommerce Statistics" (2022)
8. Invision App. "3 impressive statistics on user experience" (2015)
9. Convine & Convert. "The 6 Critical Chatbot Statistics for 2018"
10. McKinsey. "The great consumer shift: Ten charts that show how US shopping behavior is changing" (2020)
11. Statista. "Sources of information about products in the U.S. in 2022"
12. Shopify. "30+ Shopping Cart Abandonment Statistics and Strategies for Recouping Lost Sales" (2021)
13. CNBC. "A more than $761 billion dilemma: Retailers’ returns jump as online sales grow" (2022)
14. Invesp. "E-commerce Product Return Rate – Statistics and Trends [Infographic]" (2022)
15. Soocial. "25 Surprising Ecommerce Return Statistics" (2022)